Why This Policy Mistake Will Be Worse Than The Last

By Peter Tchir of Academy Securities
The Path to Q1 Deflation
The odds that we get at least one month of negative inflation data in Q1 is increasing. Will deflation become a concern in Q1? That is possible (and maybe even probable) if we continue on the course of action that we are currently taking. I do not believe that we will be worried about inflation in a meaningful way by the end of Q1. In fact, as you can tell from Inflation Risk Factors and 2 + 2 = 5, I think that we have already set ourselves on a course that we will regret.
Today we will outline how and why Q1 deflation is a bigger risk than having high inflation in Q1. I use the term “risk” because the deflation will be linked to a recession that starts sooner and will be worse than consensus (Friday’s data makes me wonder if it hasn’t already started).
Inflation
Let’s start with a closer look at where we are with inflation today.
Inflation Elimination/Simplification

This chart includes three common measures of inflation – CPI, CPI Core, and PCE Core. The point of this chart is to justify only looking at Core CPI. They all move more or less in line, with overall CPI being a little more volatile and PCE being a month behind in terms of data. So, when we use CPI in charts in later sections, we will use Core CPI because we don’t give up much information in terms of the narrative that we are creating and the charts will be much simpler to understand.
Core CPI – Chart Looking Better
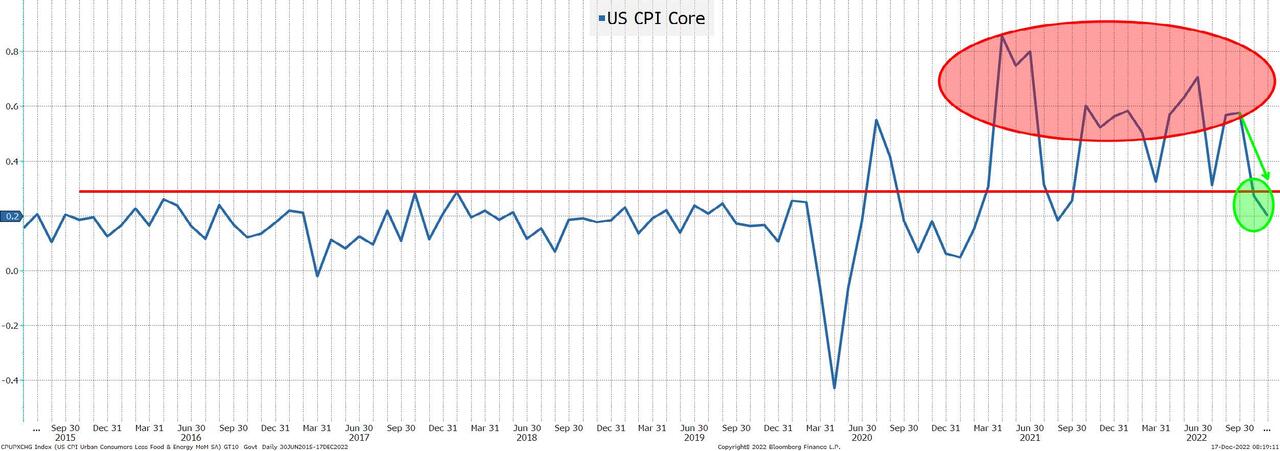
Two things that stand out on this chart:
- We have not seen an increase in the monthly data for 3 months (the trend is looking good). If this was a stock chart, it is starting to look like one that is giving up the gains and returning to normal. I’m not sure that charting and technicals are the right ways to look at economic data, but they are meant to take the emotion out of decisions and help us recognize patterns (this may be more relevant than we think).
- The past two months have been at levels that are below the top end of the range for the five years leading up to COVID. The past two months are “nothing burgers” in terms of inflation if examined from an objective viewpoint. Wasn’t the goal to get inflation lower? Wasn’t that the policy intent? Hasn’t it worked?
The Lag Effect in Action
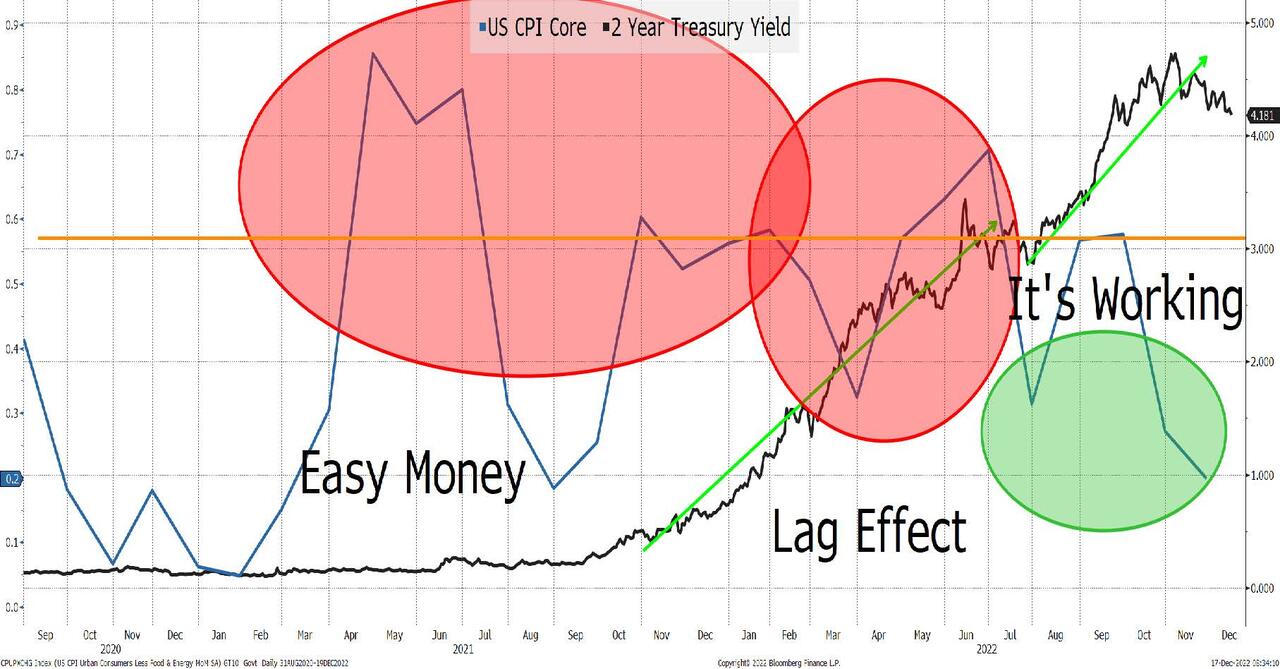
I’ve used the two-year yield here as it is a good representation of what the market is pricing in for monetary policy at the front-end (the 10-year “marches to the beat of many drums” and the front-end only responds to the actual hikes, not the anticipation of hikes, which is a monetary policy tool in and of itself).
This chart, while volatile, seems to offer some reasonably clear evidence that:
- In 2021, the easy money helped drive inflation.
- There is a lag effect in terms of monetary policy reducing inflation. Rates started rising in late 2021 and accelerated in 2022. Inflation data remained uncomfortably high as rates rose.
- Rates continued to rise, and inflation started to behave much better. I guess you could argue that it took higher yields to tame inflation (and that certainly helps), but I suspect part of it is that it takes time for higher yields to make their mark. People don’t lease a new car every day and not every mortgage resets immediately. Not everyone changes their prices to reflect changes in behavior. Certain purchases, already committed to, will still happen. The cost of carrying inventory goes up slowly as well. There is a lag effect, and my belief is that much of the “good” behavior we are seeing in inflation data is a response to prior hikes and the more recent hikes are only beginning to kick in!
- For the soft or even “Squishy Landing” crew, the fact that 2-year yields are stable recently is good. We are pricing in less future action so there is a chance that more of the policy decisions are priced in. However, this is wishful thinking as the inflation reaction is heavily skewed to prior hikes and actions, so we haven’t fully seen the impact yet (a bit disturbing since inflation for the past couple of months looks to be more and more under control).
The lag effect is real and even with that lag, inflation is behaving better. What happens when more hikes (that have already been announced) kick in? Deflation seems to come to mind, but we have potentially only just begun to go down that path.
Let’s Not Forget the Balance Sheet
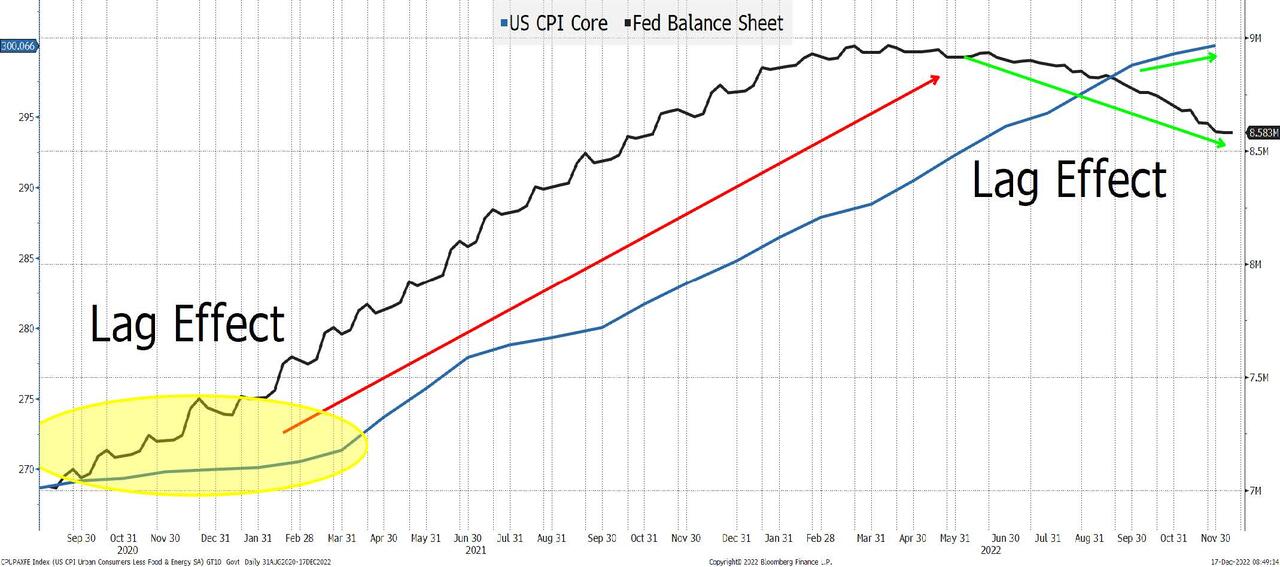
Quantitative Easing:
- Directly impacts asset prices (the riskier the asset the bigger the benefit from QE).
- The wealth effect is real in that it affects spending and is therefore inflationary.
- I believe that QT reduces asset prices. Since they are only using run-off, it isn’t as impactful as buying long-maturity assets, but it is real and will decrease wealth (in stocks, bonds, housing, and crypto to name a few areas).
- Like other parts of monetary policy, it is not always a straight line on a daily basis and there is a lag effect (it takes time for the increase in wealth to convert to greater spending, and vice versa).
So, while the market is fixated on terminal rate projections (more on that in the next section), maybe we shouldn’t ignore the impact of QT which no one has talked about changing (and they shouldn’t). I’m convinced that someone will win a Nobel Prize for highlighting how dangerous QE is as a policy tool.
To summarize this first section:
- Recent inflation data is pretty good and getting into the “normal” zone.
- The lag effect seems real, making the changes we have already seen in inflation more powerful.
- Balance sheet reduction is likely affecting asset prices and inflation.
- If not for 2021’s “failure” to identify inflation and kill QE early, we’d be pretty comfortable with the recent inflation data. We were still doing QE in 2022 even as we were discussing rate hikes.
Part of me would like to type QED now and say that we’ve proved our point and enjoy the rest of the weekend, but there is a lot more to write about to convince you why deflation is the path that we are on.
Don’t “They” Know Better?
If the policy makers had a great record of success, then I wouldn’t be worried that we are making a huge mistake and their efforts to fight inflation risk are creating a deeper recession than is necessary. But they did miss inflation and there is no reason to believe that they are any more likely to get it correct this time. In fact, you could argue that they are more likely to get it wrong, because they are dealing with the damage to their reputations from missing inflation and may have a problem acting objectively.
The DOTS – 1 Year Apart
This week the Fed spent time convincing the market that the terminal rate needs to be higher. This time last year not a single person had rates above 3% (at any time) out to 2024! By this time last year, the “transitory” story had started to shift, but we were still doing QE and talking about possible hikes, though the consensus was for less than 1% by the end of 2022! This wasn’t just a little wrong, it was very wrong! Sure, Russia’s invasion was unknown, but all throughout the year they increased the dots and terminal rate. I look at this dot plot and it gives me the energy to continue to the next section. At least I can be on the record if their hiking goes “pear shaped” and hurts the economy and the country far worse than was likely necessary!
Oil and Sauron
There are several “next steps” I could take on the path to deflation, but let’s start with oil. I guess Sauron could refer to Putin, but I was thinking more in terms of “one ring to rule them all.” There is no commodity as important as oil because it permeates the economy. It impacts the cost of producing goods, the cost of shipping goods, and how much money consumers have to spend on goods.
If Russia has to capitulate and come to some sort of a truce oil will drop even further, but that is not part of the current analysis.
Oil – Not Great, but Not Horrible

Despite OPEC+ curtailing production, the ongoing war in Ukraine, the alleged re-opening of China, and the U.S. making some purchases to refill the Strategic Petroleum Reserve, oil prices are coming down. From a CPI perspective (not Core because it excludes energy), it will be a good thing.
The two biggest “benefits” are that production and transportation costs will drop which will help to reduce inflation. But as discussed in Incongruous we should be careful what we wish for.
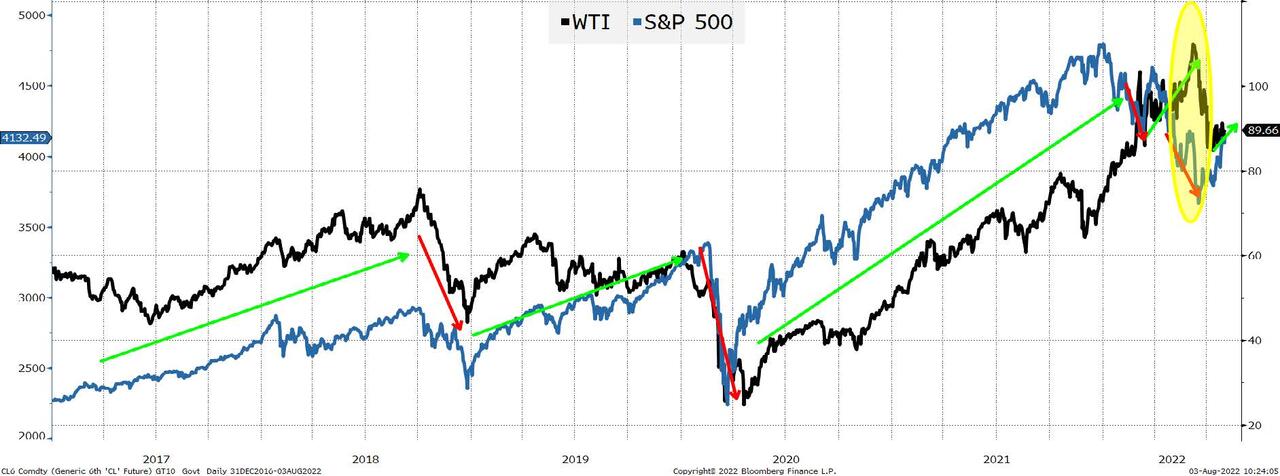
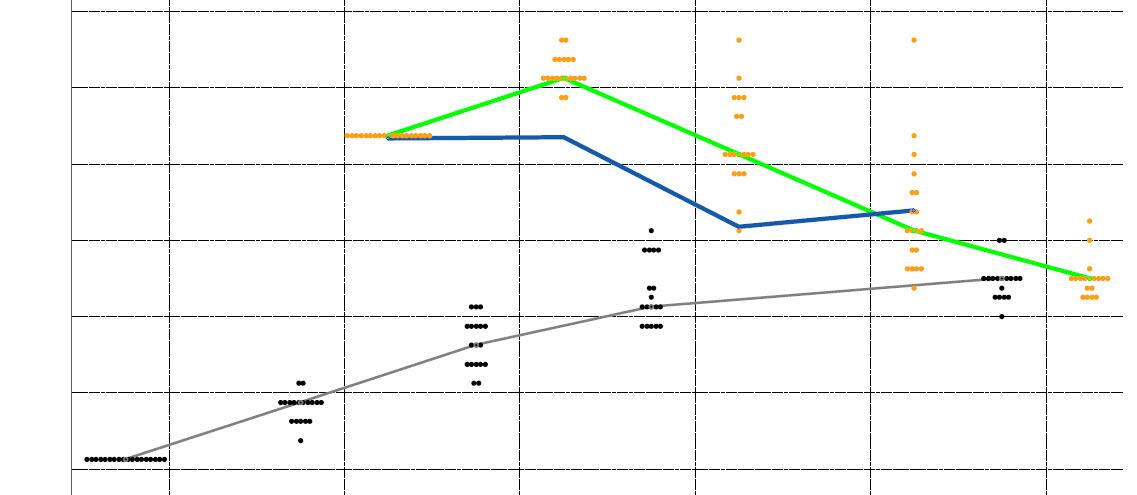
I use the 6-month forward WTI contract to smooth things out, but typically as oil goes up, stocks do well (and vice versa). That was the case from 2016 until just recently.
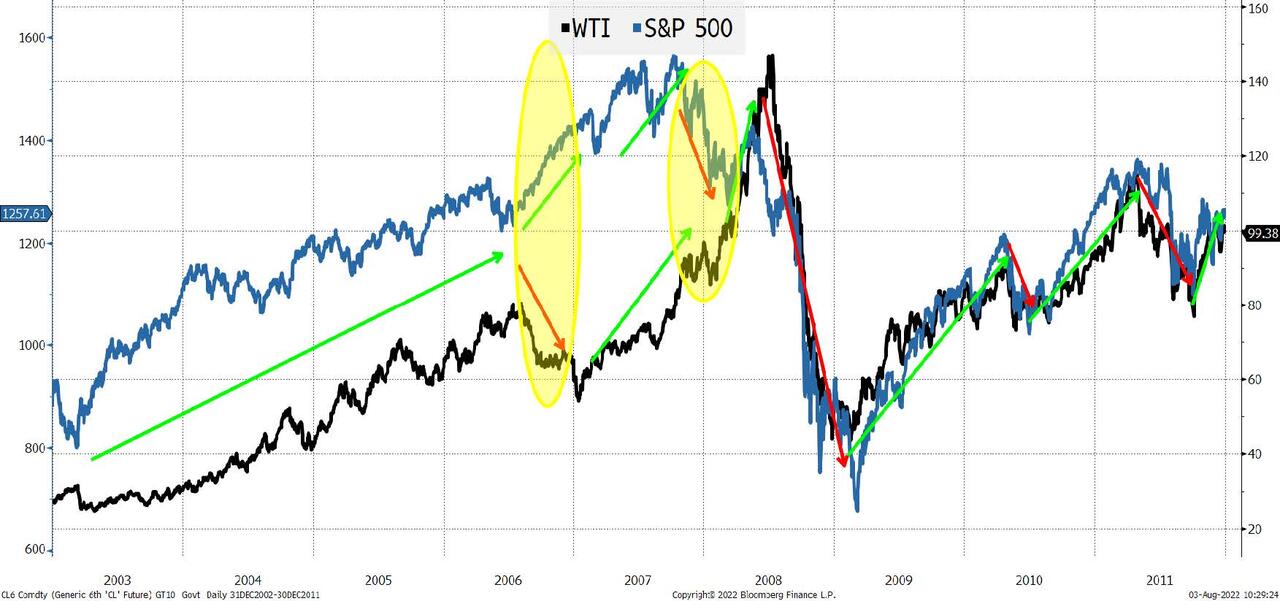
The same pattern holds true for the 2003 to 2011 period (with a couple of short exceptions).
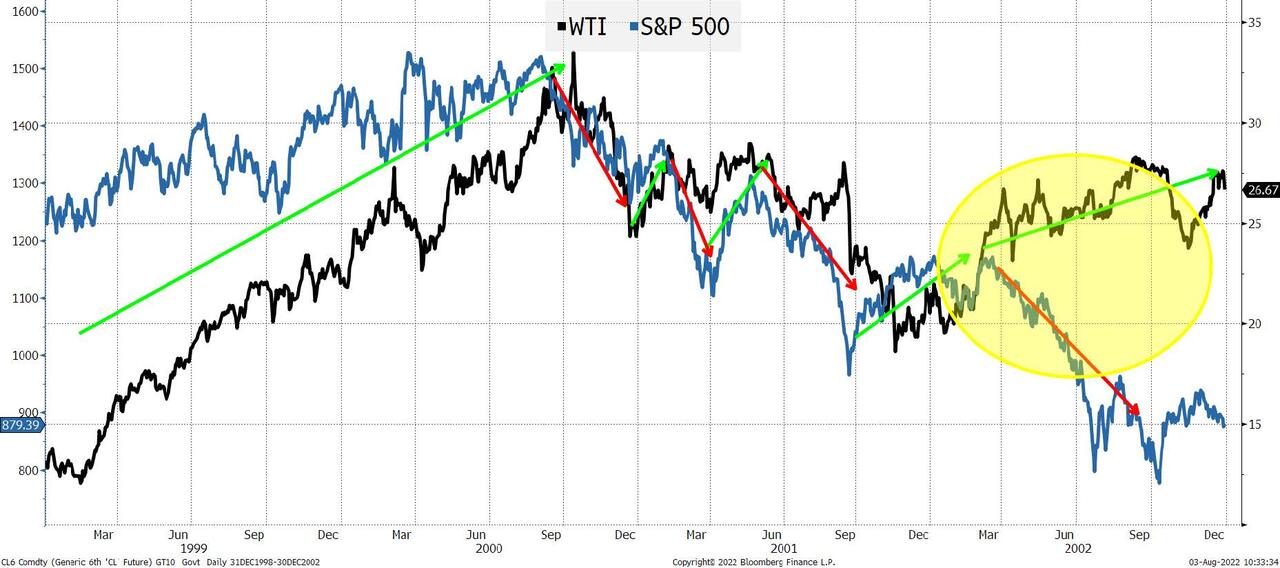
Even from 1999 until 2002 the pattern held up pretty well.
In any case, I’m not sure we should cheer low oil prices. Maybe what is counteracting all of the potential reasons for oil to be higher is that the economy is slowing much faster than is currently showing up in the official data.
I argued (vehemently) back in 2015 that higher energy prices were great for jobs and the economy overall and I still believe that.
At the time, energy was a big part of the high yield market which struggled during that timeframe (there was even an “ex-energy” ETF launched in early 2016). I think back to how that one sector so heavily affected some markets and the economy and cannot help but think of parallels to today.
The Disruptive Economy
We highlighted this so much last weekend in Inflation Drivers that I won’t rehash the argument here. What I will add is that when I look at some jobs data, “management” makes up 6.3% of the workforce but 13.4% of the income and it seems like those jobs are under pressure.
Computer and math jobs are only 3.3% of the workforce, but 5.7% of the costs. This area is still strong, but I am seeing the reshuffling of jobs as some big companies are cutting back here.
These two areas, which rank 1 and 3 in terms of wages (legal is number 2) could face pressure. That will make even small amounts of jobs lost more impactful.
Just like “energy” was the main focal point of economic (and market) problems in 2015, “disruption” seems to be front and center right now. However, while this sector isn’t a big part of the debt markets, it is a large part of the equity markets (and alternatives) and why there could be a lot more pressure if the slowdown persists (rates aren’t the main driver here, but they are not helping).
Take This Job Data and Shove It
In 2 + 2 = 5 we highlight the issues around job data, particularly the Philly Fed’s report that Q2 jobs were overstated by more than 1,000,000 in the NFP reports!

The year started with 1.3 million more workers on the Establishment Survey than on the Household Survey. They differed by 950k in Q2 (maybe the Philly Fed report has some substance).
There are a lot of issues with both sets of data, but it seems a bit “optimistic” to only focus on one measure, especially after the work the Philly Fed just did.
To put this in a different perspective, in March the unemployment rate was 3.6% (it is now 3.7%). That is based on the Household Survey. The Establishment Survey showed that 2 million more jobs were created since then, so if those jobs had shown up in the Household Survey, the unemployment rate would be about 2.2%. Just think about that. If the jobs in the Establishment Survey are correct, even from just the start of the year, we’d have sub 3% unemployment. Does this feel like an economy running that hot?
There are so many questions on the quality of the job data (and ADP is somewhere in between since they started republishing this year with their amended methodology) that it seems difficult to base our view on the job market on these numbers.
ISM Jobs Story Seems More Realistic
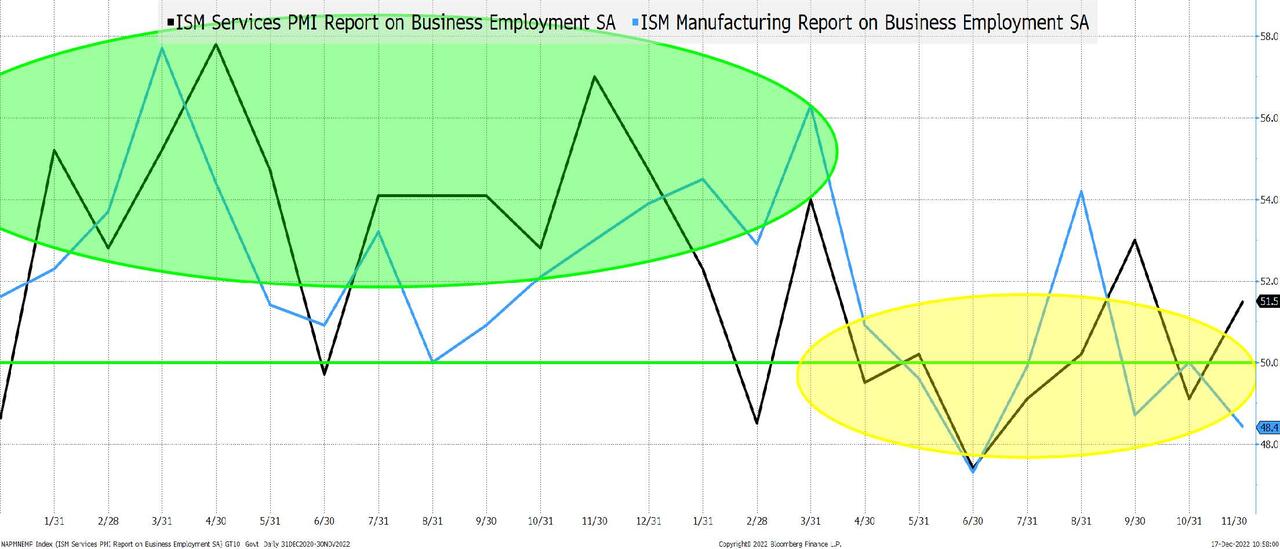
2021 was HOT! Lately, not so much! Not awful, though several months below 50 this year (even for services) doesn’t hint at a job market that is out of control, especially for the high paying jobs that really drive inflation!
I’m trying to get better at pulling data directly from indeed.com. I’m told, by some good people, that it is dropping faster than JOLTS, but I cannot yet verify that myself (at least not in an intelligible way).
This Policy Mistake Will Be Worse Than the Last
It is bad to miss inflation (especially when there were so many telltale signs that it was real and not transitory) but it will be worse to trigger a recession that is avoidable.
Who cares what the stock market does over a day or a week? Who cares if financial conditions improve a bit when so many other factors (including QT) are combining in a “perfect storm” to “normalize” inflation!
I am extremely worried that we have already done too much, and that we are pushing our economy into unnecessary danger zones when we should be focused on transforming our energy industry, redeveloping supply chains, improving trading relations, and ensuring that we are “safe” from pandemics (or at least more in control of the necessary materials).
The fight against inflation is now misplaced, and I’d rather see us living with 3% inflation and striving to accomplish a lot, rather than creating unnecessary job losses and opportunities for our competitors.
The path to deflation is becoming less avoidable and beating inflation (so badly) is not the victory that we should be striving for.
This week’s “risk-off” trading with low yields and lower equities may be a harbinger of things to come based on our apparent policy priorities and data “analysis.”
MORE MARKETS STORIES ON ZEROHEDGE

Gold Is Money: Everything Else Is Credit

Perfect Storm Arrives: “Massive Wave” Of Car Repossessions And Loan Defaults To Trigger Auto Market Disaster, Cripple US Economy

The Return Of Quant Investing
NEVER MISS THE NEWS THAT MATTERS MOST
ZEROHEDGE DIRECTLY TO YOUR INBOX
Receive a daily recap featuring a curated list of must-read stories.